The basic principles of the FTSE Indexes explained
The first thing you should understand is that the London Stock Exchange is made up of two markets where companies list their shares. There is the Main Market (where the larger companies list) and the Alternative Investment Market (where the smaller companies list). Check out our more detailed comparison of the Main Market and AIM.
Within the Main Market there is a set of indexes (essentially categories) which are called the FTSE series. The FTSE indexes are managed by FTSE Russell who are a subsidiary of the London Stock Exchange Group. The term FTSE stands for Financial Times Stock Exchange. This is a result of originally being part owned by the London Stock Exchange and the Financial Times.
What is the difference between the FTSE 100, the FTSE 250 and the FTSE 350?
![]()
The make-up of the different FTSE indexes on the Main Market is determined by a company’s market capitalisation. In simple terms this is the number of shares the company has issued, multiplied by the current share price. Quite often market capitalisation is referred to as the market value of a company.
Here are the different FTSE stock market indexes explained:
FTSE 100 — the largest 100 companies based on market capitalisation. Here you will find some extremely well-known names. The biggest companies in the FTSE 100 include global giants such as HSBC, Shell and BP.
FTSE 250 — the next tier down, so the 101st to the 350th largest companies. Some well-known companies in the FTSE 250 include household names such as easyjet, Dunelm, Domino’s Pizza and WH Smiths.
FTSE 350 – a combination of the FTSE 100 and FTSE 250 companies. The FTSE 350 index brings together the largest 350 companies listed on the UK stock market.
What is the FTSE SmallCap, the FTSE All Share and the FTSE Fledgling?
Whilst the FTSE 100, FTSE 250 and FTSE 350 indexes are often seen as the main indexes, they are not the only ones. It is also worth mentioning the FTSE SmallCap and FTSE Fledgling indexes.
FTSE SmallCap — the SmallCap index features the smaller companies. These companies meet the FTSE criteria but are too small to quality for the top 350. Amongst a wide variety of companies, you are bound to recognise many such as Wickes Group and Halfords Group.
FTSE Fledgling – Companies who make up this index are listed on the London Stock Exchange Main Market and meet the requirements of being included in the FTSE UK index series. However they are not large enough to be included in the FTSE All Share index. The FTSE Fledgling index comprises around 70 companies. FTSE Russell, review the make-up of the index annually. They will look at the market capitalisation of the companies and if they have grown large enough, they can be promoted up to the FTSE SmallCap index (subject to meeting certain criteria). You may recognise stocks such as sofa shop SCS Group and retailer The Works in the FTSE Fledgling index.
What about the FTSE All Share?
Whilst the name you lead you to believe that the FTSE All Share index contains every company listed on the stock market, that is not the case. Here is how it is broken down. The FTSE All Share index simply brings together all the companies in the FTSE 100, FTSE 250 and FTSE Small Cap indexes. This creates a very diverse list of different companies and sectors. The FTSE All Share index accounts for 98% of the total market capitalisation of companies eligible for inclusion in the UK FTSE series. So, whilst the index may not contain every single company, in terms of the market value of companies on the stock market it represents the vast majority. This means the performance of the index can give us a good indication as to the strength of the stock market as a whole.
FTSE 100 vs. FTSE 250 – how the indexes differ other than size
So, you have heard a lot about how all the different indexes are determined by the market value of the companies but what does this actually mean? What can we learn from the performance of the different indexes? Well, the FTSE 100 contains some very large companies that conduct business globally. This means the performance of this index tends to be more aligned to the state of the global economy. On the other hand, the FTSE 250 contains a higher number of companies more reliant on doing business in the UK. As a result it tends to be more representative of sentiment in the UK economy. The takeaway here is that you shouldn’t necessarily expect the indexes to always move up and down in parallel. There may be different factors at play that are causing the share prices of the companies within each index to go up and down.
FTSE 100 average return
From 2013 up to the end of 2023, on average the FTSE 100 delivered a total return of 7% per year.
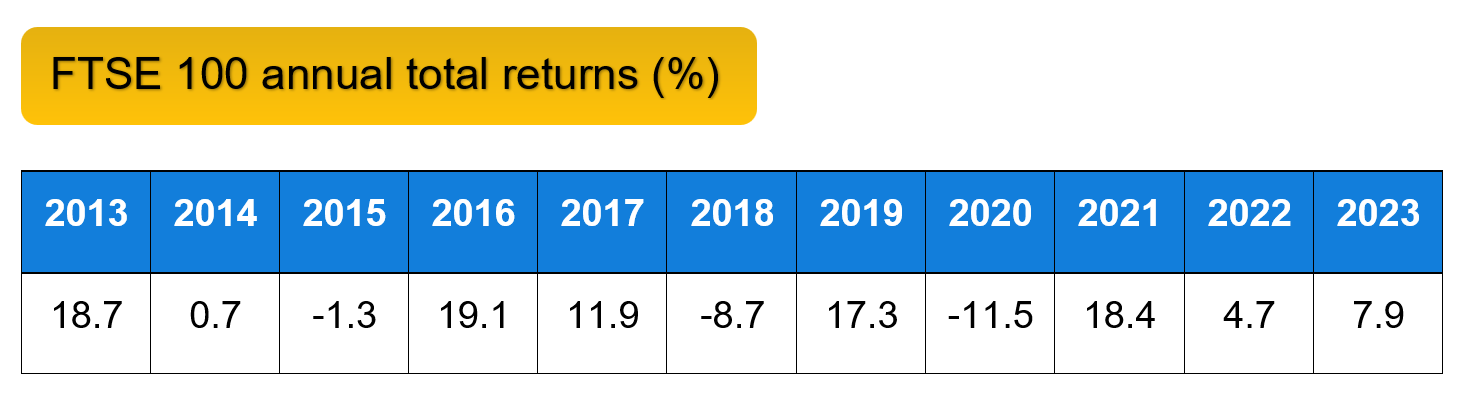
As always, its important to remember that investing requires a long-term mindset. History tells us there will always be peaks and troughs along the journey.
Keeping it simple
There are various FTSE indexes (categories) which comprise different companies listed on the London Stock Exchange Main Market. The make-up of the indexes is determined by the total market capitalisation of the companies. This is the number of shares issued multiplied by current share price. The indexes and the make-up of them are managed by FTSE Russell (a subsidiary of the London Stock Exchange). It is possible to invest in an index through buying a tracker fund.
If you’re keen to learn more make sure you check out the rest of our website or grab a copy of our free Beginner’s Guide to Investing in the Stock Market.
Data source: FTSE Russell, correct as of January 2024.
All our content is provided for educational purposes only, to help you make your own decisions. We don’t provide personalised advice and therefore our content should not be considered an invitation, inducement or recommendation to engage in any particular investment activity. Please review our disclaimer and website terms for full details.